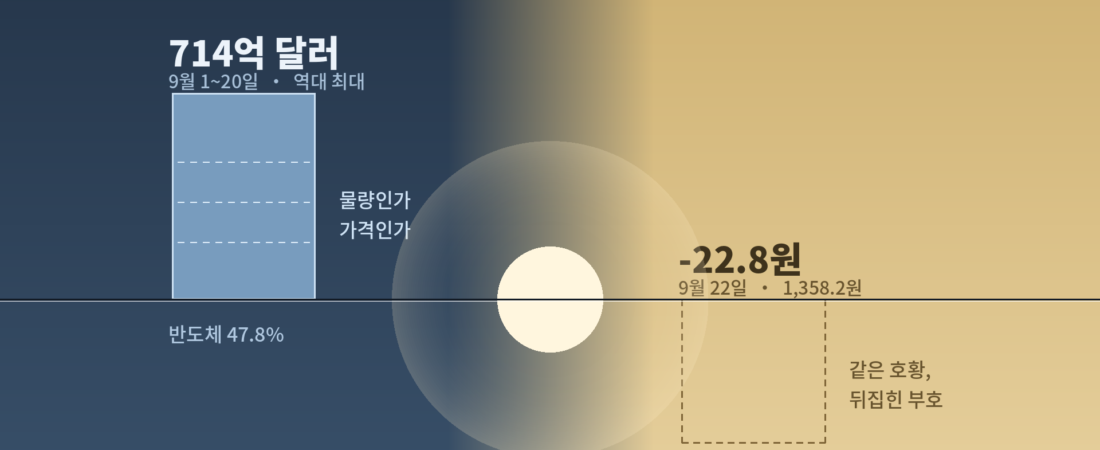
9월 21일, 세종.
관세청이 한 장짜리 자료를 냈다. 9월 1일부터 20일까지 수출 714억 달러. 역대 최대. 반도체가 259.4% 늘어 전체 수출의 47.8%를 차지했다는 문장이 그 아래에 붙었다.
다음 날 오후 3시 30분, 서울 외환시장.
원/달러 환율이 1,358.2원으로 마감했다. 하루에 22.8원이 빠졌다. 시장은 이유를 추석 앞둔 수출기업의 달러 매도라고 설명했다.
두 문서는 서로를 언급하지 않는다. 발표한 기관도 다르고, 측정하는 것도 다르다. 하지만 둘은 같은 사건의 앞면과 뒷면이다. 수출로 들어온 달러가 원화로 바뀌면서 환율을 눌렀다. 성적표와 청구서가 하루 간격으로 나온 셈이다.
그리고 이 나라 어딘가에는 세 번째 종이가 있다. 환율 가정 한 줄이 적힌 사업계획서다. 반도체를 만들지 않는 회사의 것이다. 그 한 줄은 이번 주에 조용히 틀렸다.
첫 번째 시선 — 역대 최대라는 문장
통계 당국의 언어는 총액과 증감률이다. 714억 달러, 78.3%. 이 언어의 미덕은 비교 가능성이다. 작년 같은 기간과 나란히 놓을 수 있고, 다른 나라와도 나란히 놓을 수 있다.
산업 매체의 언어는 비중이다. 반도체 47.8%. 이 언어는 구조를 보여준다. 무엇이 이 나라를 먹여 살리는가에 답한다.
시장의 언어는 가격이다. 주가와 환율. 이 언어는 미래를 할인해서 현재로 가져온다. 그래서 가장 빠르고, 가장 자주 틀린다.
세 언어는 같은 주에 같은 숫자를 다뤘다. 그리고 하나의 전제를 공유한다. 수출 금액이 나라의 성적표라는 전제다.
이 전제는 틀리지 않았다. 다만 접혀 있다. 수출 금액은 언제나 물량과 가격의 곱이다. 몇 개를 팔았는가와 얼마에 팔았는가가 하나의 숫자 안에서 접힌다. 접힌 채로 발표되고, 접힌 채로 인용되고, 접힌 채로 성적표가 된다.
두 번째 시선은 그 숫자를 다시 펴 보는 자리들의 이야기다.
두 번째 시선 — 접힌 숫자를 펴는 자리들
달력 위에서. 같은 기간 조업일수는 지난해 16.5일에서 올해 15.5일로 하루 줄었다. 총액은 일한 날짜 수에 영향을 받고, 일평균은 받지 않는다. 일평균 수출액은 24.3억 달러에서 46.1억 달러로 89.8% 늘었다. 헤드라인에 걸린 78.3%보다 크다. 헤드라인이 실제보다 작게 말한, 흔치 않은 경우다.
가격표 위에서. 시장조사기관 디램익스체인지가 집계한 8월 PC용 D램(DDR4 8Gb) 고정거래가격은 25달러였다. 전월보다 4.2% 올랐고, 역대 최고치다. 2016년 6월의 2.9달러와 비교하면 여덟 배가 넘는다. 낸드플래시(128Gb MLC)는 30.5달러, 1.4% 상승으로 역시 최고치를 경신했다. 그렇다면 반도체 수출 259.4% 증가 가운데 얼마가 더 많이 판 것이고 얼마가 더 비싸게 판 것인가. 금액 통계는 그 질문에 답하지 않는다. 답하도록 설계되지 않았다.
상승률의 기울기 위에서. 같은 집계에서 상승 속도는 둔화되고 있다. 낸드 SLC 제품의 월간 상승률은 7월 34~51%에서 8월 16~28%로 줄었다. 가격은 여전히 최고치지만, 최고치를 갱신하는 속도는 느려졌다. 가격이 밀어 올린 금액은 가격이 멈추면 함께 멈춘다. 물량이 밀어 올린 금액과 수명이 다르다.
타이베이의 설명 위에서. 대만 재정부는 8월 수출이 824억 달러로 41.0% 늘어 사상 최대를 기록했다고 발표했다. 34개월 연속 증가다. 전자부품 322.2억 달러(58.0% 증가)와 정보통신 331.0억 달러(41.8% 증가)를 합치면 전체 수출의 79.3%다. 그런데 발표를 맡은 재정부 통계처장은 호실적의 원인을 네 가지로 나눠 말했고, 그중 하나가 “공급 병목에 따른 전자제품 가격 상승”이었다. 당국이 스스로 물량과 가격을 갈라 말한 것이다. 같은 사이클 위에 선 두 나라가 있고, 한쪽의 집중도는 79.3%, 다른 쪽은 47.8%다. 노출의 크기는 다르지만 노출의 성격은 같다.
외환시장 창구 위에서. 9월 1~20일 무역수지는 230억 달러 흑자였다. 수입 484억 달러를 빼고 남은 돈이다. 이 달러는 결국 원화로 바뀐다. 급여를 주고 세금을 내야 하기 때문이다. 스무 날 만에 230억 달러가 남았다는 말은, 그만큼의 달러 매도 압력이 시장 어딘가에 쌓여 있다는 말과 같다. 추석이라는 달력은 그 압력의 배출 시점을 앞당겼을 뿐이다. 여기가 부호가 바뀌는 자리다. 수출에서 플러스였던 숫자가 환율에서는 마이너스가 되어 나타난다.
그리고 사업계획서 위에서. 반도체가 47.8%라는 말은 나머지가 52.2%라는 말이다. 같은 기간 승용차 수출은 9.3% 늘었다. 나쁜 숫자는 아니다. 다만 259.4%와 같은 환율을 쓴다. 원화가 강해지면 같은 물량을 팔아도 원화로 환산한 매출이 줄어든다. 반도체 호황이 만든 원화 강세가, 반도체를 만들지 않는 기업의 손익계산서에 도착한다. 도착할 때 그것은 더 이상 호황이 아니다.
세 번째 시선 — AURA의 시선
EP.010에서 우리는 리스크가 사라지지 않고 이동한다고 썼다. 해협에서 요율로, 요율에서 운임으로, 운임에서 도입단가로, 도입단가에서 마진으로. 리스크는 소멸하지 않고 주소를 바꾼다.
이번 주의 숫자들은 그 명제의 뒷면을 보여준다. 호황도 이동한다. 그리고 이동하는 동안 부호를 바꾼다.
경로는 똑같이 선명하다. 반도체 가격 상승 → 수출 금액 증가 → 무역수지 흑자 → 달러 공급 증가 → 원화 강세 → 반도체 아닌 수출기업의 채산성 악화. 시작점에서 이것은 명백한 좋은 소식이다. 도착점에서 같은 사건은 비용이다. 중간에 아무도 나쁜 짓을 하지 않았고, 어떤 정책도 실패하지 않았다. 그저 한 산업의 성공이 환율이라는 장치를 통과했을 뿐이다.
그래서 환율을 물가 지표나 투자 지표로만 보는 것은 절반의 독법이다. 환율은 산업 간 재분배 장치이기도 하다. 조세처럼 국회를 거치지도 않고, 보조금처럼 예산에 잡히지도 않는다. 그런데 매일 열리고 매일 정산된다. 한 산업이 크게 벌면, 그 나라의 다른 수출 산업은 고지서를 받는다. 고지서에는 발신인이 적혀 있지 않다.
여기서 두 번째 개념이 나온다. 접힌 숫자다. 수출 금액은 물량과 가격이 곱해져 접힌 값이고, 접힌 상태에서는 방향만 보이고 수명은 보이지 않는다. 물량이 만든 호황은 설비와 주문에 기반하므로 길게 간다. 가격이 만든 호황은 병목에 기반하므로 병목이 풀리는 순간 끝난다. 두 호황은 통계표 위에서 똑같이 생겼다. 그래서 “역대 최대”라는 문장은 그 자체로는 미래에 대해 아무것도 말하지 않는다.
대만 재정부가 네 가지 원인을 나눠 말한 것은 그래서 사소한 일이 아니다. 접힌 숫자를 발표자가 직접 펴 주었다는 뜻이다. 통계의 품질은 자릿수가 아니라 분해 가능성에서 나온다.
실무의 언어로 옮기면 세 가지다.
기업은 이번 분기 실적을 볼 때 금액 증가율과 단가 증가율을 나눠 봐야 한다. 특히 반도체를 만들지 않는 수출기업이라면, 좋은 뉴스가 많은 계절일수록 환헤지 비율과 계약서의 가격 조정 조항을 먼저 본다. 남의 호황이 내 원가에 도착하는 데는 시차가 있고, 그 시차가 유일한 준비 시간이다.
투자자는 수출 통계를 실적 선행지표로 쓸 때 그것이 몇 개짜리 지표인지 확인해야 한다. 금액 기준 통계는 가격 상승기에 실적을 과대 표시하고 가격 하락기에 과소 표시한다. 같은 함정이 해상운임 지수에도 있다. 지수가 오른다고 물동량이 는 것은 아니다.
정책의 자리에서는 하나의 질문이 남는다. 환율이 재분배 장치라면, 그 재분배는 누구의 결정인가. 아무도 결정하지 않았다는 것이 이 장치의 특징이자 문제다.
AURA Insight
한 나라의 수출에서 한 품목이 절반에 가까워질 때, 통계는 점점 더 정확해지면서 점점 덜 대표하게 된다. 714억 달러는 틀린 숫자가 아니다. 다만 그것은 이제 나라의 평균이 아니라 한 산업의 성적에 가깝다.
평균값의 문제는 그것이 누구의 현실도 아니라는 데 있다. 국가 통계는 평균을 말하고, 기업은 분산 속에서 산다. 두 세계의 거리가 멀어질수록, “역대 최대”라는 문장을 듣고 자기 회사의 장부를 보는 사람의 표정은 복잡해진다.
이것은 한국만의 이야기가 아니다. 대만은 같은 자리에 더 깊이 들어가 있고, 그래서 같은 질문을 더 일찍 받게 될 것이다. AI라는 하나의 수요가 세계의 여러 나라를 같은 방향으로 밀고 있다. 밀리는 각도가 나라마다 다를 뿐이다.
세계를 이해한다는 것은 더 많은 뉴스를 아는 일이 아니다. 하나의 숫자가 몇 개의 현실로 접혀 있는지를 아는 일이다. 접힌 숫자를 펴는 데는 도구가 필요하지 않다. 곱셈이 어디서 일어났는지 묻는 문장 하나면 된다.
이번 주, 그 질문은 이렇게 생겼다. 그 714억 달러는 더 많이 팔아서 만든 것인가, 더 비싸게 팔아서 만든 것인가. 그리고 그 답이 바뀌는 날, 환율은 어느 쪽으로 움직이는가.
AURA Question
당신의 회사가 올해 받은 가장 좋은 소식은, 누구의 호황이 이동해 온 것이었습니까?
함께 읽으면 좋은 글
- 환율 하루에 22원 급락 — 추석 연휴 지나면 되돌아올까
- EP.010 — 해협은 열렸다. 그런데 배가 오지 않는다
- 해상운임 3배 올랐다는데 우리 견적은 왜 그대로일까 — 운임지수 3종 차이
- 달러 투자 방법 4가지 비교
- 환율이 오르면 나에게 생기는 일 5가지
English Edition — The Other Side of a Record
Three Perspectives, EP.011 — On folded numbers, and what happens to a boom in transit.
Monday, 21 September. Sejong.
Korea’s customs service released a single sheet of paper. Exports for the first twenty days of September: $71.4 billion. A record. Semiconductors up 259.4 per cent, now 47.8 per cent of everything the country sold abroad.
The next afternoon, at 3:30, in the Seoul foreign exchange market, the won closed at 1,358.2 to the dollar. Down 22.8 won in a single session. Traders explained it as exporters selling dollars ahead of the Chuseok holiday.
The two documents do not mention each other. Different agency, different instrument, different unit. Yet they are the front and back of one event. Dollars earned abroad become won at home, and the won rises. A report card and an invoice, issued a day apart.
And somewhere in the country there is a third sheet of paper: a business plan with one line for the assumed exchange rate, written by a company that does not make chips. That line quietly became wrong this week.
The First Perspective — The Sentence “Record High”
Statistical agencies speak in totals and growth rates. $71.4 billion, up 78.3 per cent. The virtue of this language is comparability — against last year, against other countries.
Industry press speaks in shares. Semiconductors, 47.8 per cent. This language shows structure: what actually carries the economy.
Markets speak in prices. Equities and the exchange rate. This language discounts the future into the present, which makes it the fastest and the most frequently wrong.
Three languages, one week, one set of numbers. And one shared premise: that the export total is the nation’s report card.
The premise is not false. It is folded. An export figure is always volume multiplied by price — how many were sold, and at what. Both live inside a single number. It is published folded, quoted folded, and read as a verdict folded.
The Second Perspective — The Places Where the Number Gets Unfolded
On the calendar. Working days fell from 16.5 last year to 15.5 this year. Totals are sensitive to the number of days worked; daily averages are not. Average daily exports rose from $2.43 billion to $4.61 billion — 89.8 per cent, larger than the 78.3 per cent in the headline. A rare case of a headline understating what happened.
On the price list. DRAMeXchange put the August contract price of PC DRAM (DDR4 8Gb) at $25.00, up 4.2 per cent on the month and an all-time high — more than eight times the $2.90 of June 2016. NAND flash (128Gb MLC) reached $30.50, up 1.4 per cent, also a record. So how much of that 259.4 per cent is more chips, and how much is dearer chips? The value statistic does not answer. It was never built to.
On the slope. In the same data, the rate of increase is easing. Monthly gains for NAND SLC products narrowed from 34–51 per cent in July to 16–28 per cent in August. Prices remain at record levels; the speed at which records are being set does not. A boom made of price ends when the price stops. A boom made of volume does not have the same life expectancy.
On a podium in Taipei. Taiwan’s finance ministry reported August exports of $82.4 billion, up 41.0 per cent — the highest monthly figure on record and a 34th consecutive month of growth. Electronic components ($32.22 billion, up 58.0 per cent) and information and communications products ($33.10 billion, up 41.8 per cent) together accounted for 79.3 per cent of all exports. But the official presenting the data broke the result into four causes, and one of them was supply bottlenecks pushing electronics prices up. The authority unfolded its own number. Two countries stand on the same cycle; one is 79.3 per cent exposed, the other 47.8. The size of the exposure differs. Its nature does not.
At the currency window. The trade surplus for those twenty days was $23.0 billion. That money eventually becomes won, because wages and taxes are paid in won. A $23.0 billion surplus is, in another vocabulary, $23.0 billion of latent selling pressure. The holiday calendar only moved the release forward. This is where the sign flips. What was a plus in the trade statistic arrives as a minus in the exchange rate.
And on the business plan. If semiconductors are 47.8 per cent, everything else is 52.2. Passenger cars rose 9.3 per cent over the same period — not a bad number. It simply uses the same exchange rate as the 259.4 per cent. A stronger won means the same shipment converts into less revenue at home. The currency strength created by a chip boom arrives on the income statement of a company that makes no chips. By the time it arrives, it is no longer a boom.
The Third Perspective — AURA
In EP.010 we wrote that risk does not disappear; it relocates. Strait to premium, premium to freight, freight to import cost, import cost to margin. Risk changes address rather than vanishing.
This week’s numbers show the other face of that proposition. Booms relocate too. And in transit, they change sign.
The route is equally legible. Chip prices rise, export values rise, the trade surplus widens, dollar supply increases, the won strengthens, and exporters outside semiconductors lose margin. At the origin this is unambiguously good news. At the destination, the same event is a cost. No one behaved badly in between and no policy failed. One industry’s success simply passed through a mechanism called the exchange rate.
Which is why reading the currency only as a price index or an investment variable is half a reading. The exchange rate is also a redistribution device between industries. Unlike taxation it passes through no legislature; unlike subsidy it appears in no budget line. Yet it opens every morning and settles every evening. When one industry earns heavily, the country’s other exporters receive a bill. The bill carries no sender.
Hence the second idea: the folded number. An export value is volume times price, compressed into one figure, and in that compressed state it reveals direction but hides duration. A boom built on volume rests on orders and capacity, so it lasts. A boom built on price rests on a bottleneck, and ends when the bottleneck clears. On a statistical table the two look identical. Which is why “record high”, by itself, says nothing whatsoever about next year.
Taiwan’s decision to name four separate causes is therefore not a small thing. The publisher unfolded the number on the reader’s behalf. The quality of a statistic lies not in its digits but in its decomposability.
Translated into practice, three things follow. Companies should separate value growth from unit-price growth when reading a quarter — and exporters outside the chip complex should check hedge ratios and price-adjustment clauses precisely in the seasons when the news is good, because the lag before someone else’s boom reaches their costs is the only preparation time they get. Investors using trade data as a leading indicator should ask whether the series counts units or currency; value-based measures overstate in rising-price periods and understate in falling ones, a trap that shipping indices share. And at the level of policy, one question remains: if the exchange rate redistributes, whose decision is that redistribution? That no one decided it is both the feature and the problem.
AURA Insight
When a single product approaches half of a country’s exports, the statistic becomes more precise and less representative at the same time. $71.4 billion is not a wrong number. It is simply closer to one industry’s result than to a nation’s average.
The trouble with an average is that it is nobody’s reality. National statistics speak in means; companies live in the variance. The further those two drift apart, the more complicated the face of the person who hears “record high” and then opens their own ledger.
This is not only a Korean story. Taiwan stands deeper in the same position and will therefore face the same question sooner. One source of demand is pushing many countries in one direction. Only the angle of the push differs.
To understand the world is not to know more news. It is to know how many realities a single number has been folded into. Unfolding requires no instrument — only a sentence asking where the multiplication happened.
This week, that sentence looks like this. Was the $71.4 billion made by selling more, or by selling dearer? And on the day that answer changes, which way does the currency move?
AURA Question
The best news your company received this year — whose boom had it travelled from?
Sources
사실
- 관세청 「2026년 9월 1일~20일 수출입현황」(2026-09-21 발표): 수출 714억 달러(전년 동기 대비 +78.3%), 수입 484억 달러(+26.7%), 무역수지 230억 달러 흑자. 일평균 수출 46.1억 달러(전년 24.3억 달러, +89.8%), 조업일수 15.5일(전년 16.5일). 반도체 +259.4%·수출 비중 47.8%, 석유제품 +47.8%, 승용차 +9.3%. 연간 누계 수출 7,649.97억 달러(+55.0%).
- 원/달러 환율 2026년 9월 22일 서울외환시장 오후 3시 30분 주간거래 종가 1,358.2원(전일 대비 -22.8원), 장중 저점 1,352.9원 — 국내 언론 보도(2026-09-22).
- 메모리 고정거래가격(디램익스체인지 집계, 2026-09-01 보도 기준): 8월 PC용 D램 DDR4 8Gb 1Gx8 25.00달러(전월 대비 +4.2%, 역대 최고, 2016년 6월 2.90달러 대비 8배 이상), 낸드플래시 128Gb 16Gx8 MLC 30.50달러(+1.4%, 역대 최고). 낸드 SLC 월간 상승률 7월 34~51% → 8월 16~28%.
- 대만 재정부 2026년 8월 수출입 통계(2026-09-09 발표): 수출 824억 달러(+41.0%, 월간 사상 최대, 직전 기록 2026년 3월 801.8억 달러), 34개월 연속 증가. 전자부품 322.2억 달러(+58.0%), 정보통신 331.0억 달러(+41.8%), 두 품목 합계 전체 수출의 79.3%. 수입 601억 달러(+44.3%), 무역흑자 223억 달러(+32.9%, 월간 사상 최대). 지역별: 중국·홍콩 211.5억 달러(+39.3%), 미국 236.7억 달러(+20.7%), 아세안 151.3억 달러(+42.2%), 일본 36.6억 달러(+32.0%), 유럽 44.5억 달러(+34.8%).
- 대만 재정부 통계 담당자는 호실적 요인으로 ⑴ AI 관련 반도체 수요 지속 ⑵ AI 투자가 뒷받침한 세계 경제 성장 ⑶ 주요 스마트폰 출시 전 재고 재축적 ⑷ 공급 병목에 따른 전자제품 가격 상승을 제시했다 — 대만 현지 매체 보도(2026-09-09).
해석
- 수출 금액을 ‘물량’과 ‘가격’으로 분해해 읽어야 한다는 논지, 그리고 이를 ‘접힌 숫자’로 개념화한 것은 AURANIM의 편집적 해석입니다.
- 반도체 가격 상승 → 수출 금액 증가 → 무역수지 흑자 → 달러 공급 증가 → 원화 강세 → 비반도체 수출기업 채산성 악화라는 경로 서술은 각 단계의 공표 자료를 연결한 해석이며, 단계별 기여도를 계량한 공식 분석이 아닙니다.
- ‘환율은 산업 간 재분배 장치’라는 규정은 AURANIM의 개념화입니다. 경제학의 표준 용어가 아닙니다.
- 9월 22일 환율 하락의 배경으로 추석 전 수출업체 달러 매도, 외국인의 국내 주식·채권 관련 달러 매도, 국제유가 하락, 위험선호 회복이 보도됐습니다. 각 요인의 기여도는 확인되지 않습니다.
불확실
- 반도체 수출 증가분(259.4%) 가운데 물량 요인과 가격 요인의 비율은 공표 통계로 분리되지 않습니다. 본문은 이 비율을 제시하지 않으며, 분리되지 않는다는 사실 자체를 논지로 삼았습니다.
- 메모리 고정거래가격은 시장조사기관 집계값이며 개별 기업의 실제 거래가와 다를 수 있습니다.
- 원화 강세가 개별 비반도체 수출기업의 손익에 미치는 크기는 기업별 헤지 비율·결제 통화·계약 조건에 따라 크게 달라지며, 일반화할 수 없습니다.
- 향후 환율과 메모리 가격의 방향은 예측할 수 없습니다. 이 글은 특정 수준이나 시점을 제시하지 않으며, 투자 판단의 근거로 쓰일 수 없습니다.